IMMIGRATION FACTS & RESOURCES

IMMIGRATION TIMELINE

View our interactive timeline to learn more about organization, discover information about the United States’ historical approach to immigration, and global events that have shaped US Immigration policy.
1882
Chinese Exclusion Act of 1882

First U.S. law to ban immigration based on nationality, targeting Chinese laborers.

1891
Immigration Bureau Formed
Established to oversee immigration and enforce federal laws.
1907
Expatriation Act
Stripped U.S. women of citizenship if they married foreign men.
1917
Banned Zone Act
Restricted immigration from much of Asia with the "Asiatic Barred Zone."
1942
Executive Order 9066

Authorized the internment of Japanese Americans during WWII.

1948
Displaced Persons Act
Allowed entry for European refugees displaced by WWII
1953
Refugee Relief Act

Provided visas to refugees fleeing communism and natural disasters.

1965
US Quota System Ends
Replaced national origin quotas with a preference system based on family reunification and skills.
1975
Indochina Migration & Refugee Assistance Act
Facilitated resettlement of refugees from Vietnam, Cambodia, and Laos post-Vietnam War.
1980
Refugee Act of 1980
Established a standardized system for admitting and resettling refugees in the U.S.
1986
Simpson-Mazzoli Act Signed
Legalized undocumented immigrants while strengthening border security and employment verification.
1990
Immigration Reform Act
Increased immigration limits and created the Diversity Visa lottery program.
1994
1994 passage of section 245(i)
Allowed certain undocumented immigrants to adjust status if they paid a penalty fee.
1996
Illegal Immigration Reform and Immigrant Responsibility Act
Tightened immigration enforcement, increased penalties, and expedited deportation processes.
1997
Renewal of Section 245 (i)
Temporarily extended the adjustment-of-status provision for undocumented immigrants.
2001
Renewal of Section 245 (i) DREAM Act
Proposed but failed to provide legal status for undocumented youth brought to the U.S. as children.
2001
9/11 and Reshaping of U.S. National Security Bureaucracy
Established the Department of Homeland Security and restructured immigration enforcement agencies.
2007
2007 Immigration Reform Bill
Comprehensive reform proposal that included a path to citizenship, enhanced border security, and a guest worker program but ultimately failed in Congress.
2012
2012 DACA Executive Order
Provided temporary protection from deportation and work authorization for undocumented immigrants brought to the U.S. as children.
2015
DAPA Executive Order Challenged
Proposed protections for parents of U.S. citizens but was blocked by court rulings.
2017
2017 Executive Order (Muslim Ban)
Restricted entry from several predominantly Muslim countries, sparking widespread legal and public opposition.
2018
2018 Supreme Court Ruling on Public Charge
Expanded the definition to deny green cards based on likely use of public benefits.
2024
2024 Bipartisan Immigration Bill Fails in Congress
A major attempt at comprehensive immigration reform failed to gain sufficient support.

Economic Contributions of immigrants

Immigrants' Economic Contributions

Foreign Born v. US Born

Demographic Comparisons

Immigrant Tax Contributions in Connecticut

Immigrant Tax Contributions

Immigrant Spending Power Impact

Immigrant Spending Power Impact

Top Industries with the Highest Share of Immigrant Workers

Top Industries for Immigrant Workers

Education levels: foreign born v US born

Education Levels: Foreign-Born vs U.S.-Born

Foreign-Born Population by County

Foreign-Born Population by County

Naturalized Citizenship Rates

Naturalized Citizenship Rates by County

Immigrant Population Percentage by County

Immigrant Population Percentage by County
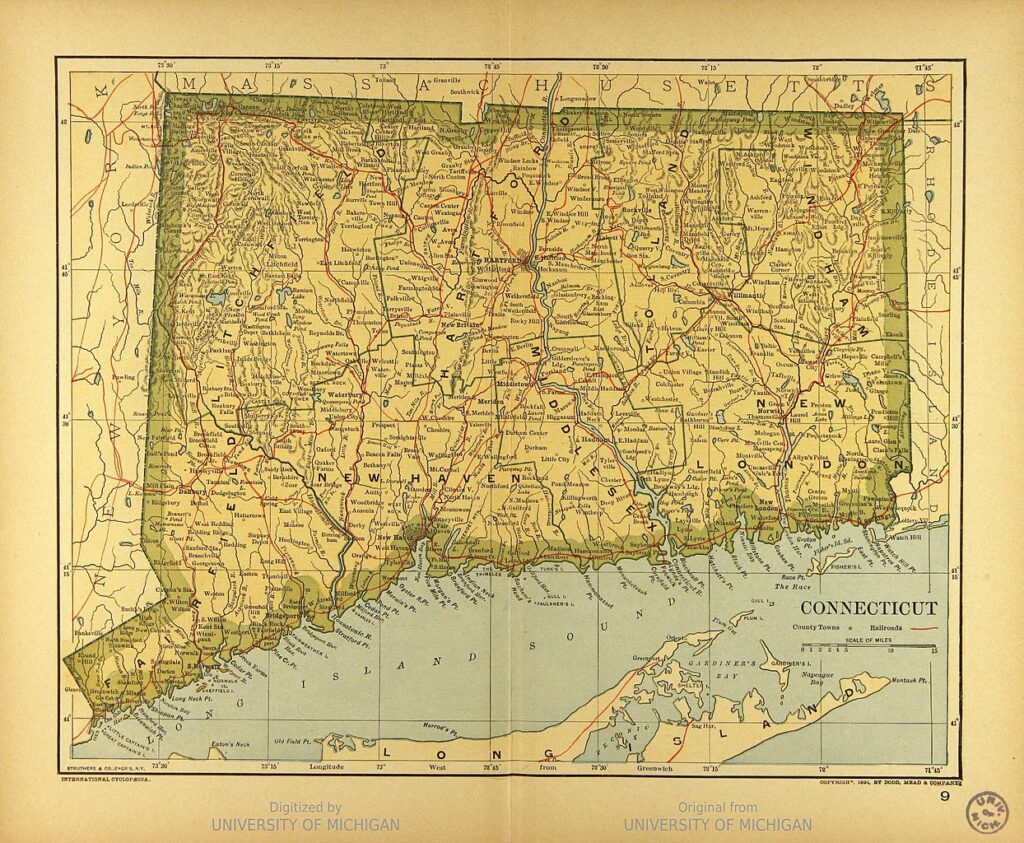
Map_of_Connecticut

Immigrants in Connecticut: Fast Facts

  • 15% of Connecticut’s population is made up of immigrants—that’s 1 in 7 people!
  • 16% of residents are native-born citizens with at least one immigrant parent.
  • The foreign-born population has nearly doubled since 1990, reflecting vibrant growth.
  • More than half of all immigrants in the state are naturalized U.S. citizens.
  • Connecticut is home to over 3,500 active DACA recipients, though many more are eligible. Unfortunately, as of 2019, only one-third of eligible individuals had applied for DACA.

Immigrants’ Impact on Connecticut’s Workforce and Economy

  • 1 in 6 workers in Connecticut is an immigrant, playing vital roles in industries like construction, healthcare, and technology.
  • Undocumented immigrants paid over $335 million in federal taxes and $200 million in state and local taxes.
  • DACA recipients and eligible individuals paid nearly $14 million in state and local taxes.


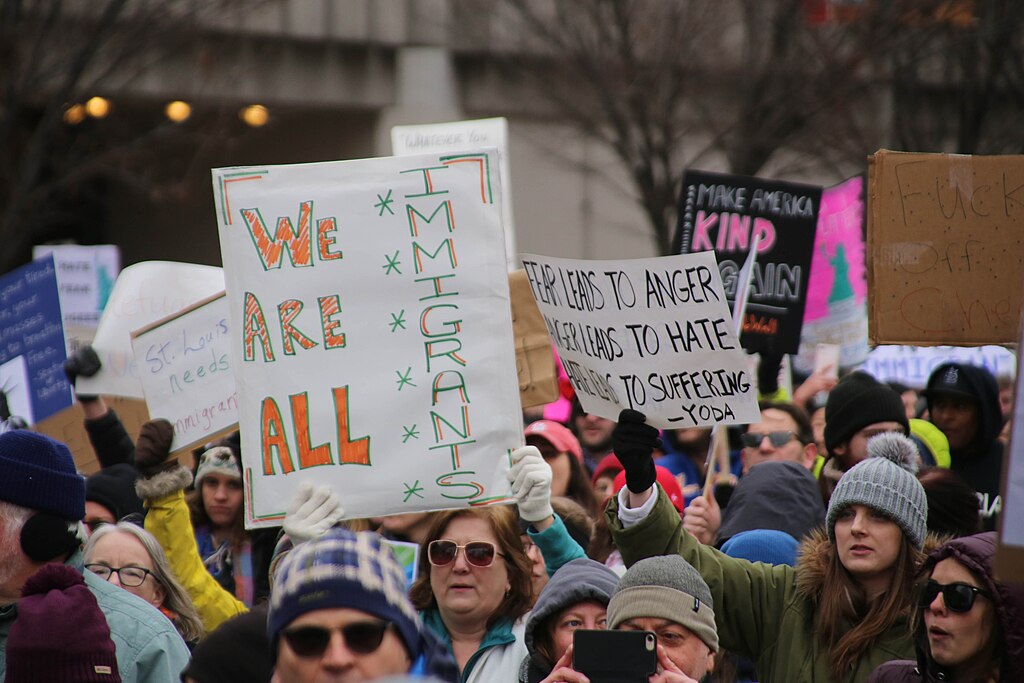
Immigration_Rally_We_are_all_Immigrants_(32599909432)
havenly-immigrant-owned-restaurant-ct

Immigrant Entrepreneurs Fuel Local Business

  • Nearly 50,000 immigrant business owners call Connecticut home, making up 24% of all self-employed residents.
  • These businesses exclusively generated an impressive $1.2 billion in income in 2018 alone.

A Welcoming State

Connecticut is one of 11 sanctuary states, committed to protecting immigrant rights and fostering inclusivity.

CONNECTICUT COUNTIES IMMIGRATION FACTS

Hover over the markers to discover immigration facts for each county.

map-of-ct
FAIRFIELD
  • Fairfield is home to an estimated 217,000 foreign born people
  • Over half of the foreign born people in Fairfield are naturalized US citizens
  • 71% of foreign born people in Fairfield are in the labor force. This is higher than both the rates for the total population (67%) and for the native born population (66%), with foreign born people who are not citizens having the highest rate of all (74%)
  • 22% of the population of Fairfield County are immigrants. That's the highest percentage in the state!
HARTFORD
  • Hartford is home to an estimated 134,000 foreign born people
  • Nearly 60% of the foreign born people in Hartford are naturalized US citizens
  • Roughly 22% of the population of the city of Hartford are immigrants!
  • At 15%, Hartford County has the second highest percentage of foreign-born in Connecticut!
  • 1 in 4 foreign-born people in Hartford arrived after 2010
NEW HAVEN
  • New Haven is home to an estimated 127,000 foreign born people
  • 53% of the foreign born people in New Haven are naturalized US citizens
  •  38% of the foreign born population in New Haven have a bachelor's degree or have completed a graduate or professional degree
  • 12% of the population of New Haven County are immigrants
  • 17% of the population of the city of New Haven are immigrants
  • With 75% earning less than $75,000 per year, and 50% earning less than $40,000 per year, the median household income for an immigrant-headed household in New Haven (about $40,000 per year) is significantly lower than the median income of immigrant-headed households in the rest of the state (about $64,000 per year).
LITCHFIELD
  • Litchfield is home to an estimated 14,000 foreign born people
  • 58% of the foreign born people in Litchfield are naturalized US citizens
TOLLAND
  • Tolland is home to an estimated 10,000 foreign born people. That's almost 7% of the population!
  • 53% of the foreign born people in Tolland are naturalized US citizens
  • 7% of the population of Tolland are immigrants
WINDHAM
  • An estimated 4.6% of the population of Windham are foreign born persons
  • 5% of the population of Windham are immigrants, the lowest percentage in the state.
MIDDLESEX
  • Middlesex is home to an estimated 13,000 foreign born people
  • 64% of the foreign born people in Middlesex are naturalized US citizens
  • 8% of the population of Middlesex are immigrants
NEW LONDON
  • New London is home to an estimated 23,000 foreign born people
  • 60% of the foreign born people in New London are naturalized US citizens
  • About 10% of the population of New London are immigrants