IMMIGRATION FACTS / RESOURCES

IMMIGRATION TIMELINE

View our interactive timeline to learn more about organization, discover information about the United States’ historical approach to immigration, and global events that have shaped US Immigration policy.
1882
Chinese Exclusion Act Immigration Act of 1882
1891
Immigration Bureau formed
1907
Expatriation Act
1917
Banned Zone Act (Middle East)
1942
Executive Order 9066 (Japanese internment)
1948
Displaced Persons Act
1953
Refugee Relief Act
Operation Wetback
1965
US Quota system ends, with the passage of the Immigration and Nationality Act
1975
Indochina Migration & Refugee Assistance Act (Vietnam War)
1980
Refugee Act of 1980

Mariel Boatlift and the arrival of 125,000 cubans in Miami

1982
The Episcopal Diocese of Connecticut forms the Diocesan Refugee Services Committee

The Diocesan Refugee Services Committee resettles Vietnamese and Southeast Asian refugee families for the following decade.

1983
The Second Sudanese Civil War begins

For the following two decades, the Second Sudanese Civil War displaces and orphans over 20,000 Sudanese boys, who later become known as the “Lost Boys of Sudan”.

1986
Immigration Reform and Control Act

To address the problem of unauthorized immigration, Congress implemented through bipartisan agreement a multi-pronged system that provided amnesty for established residents, increased border enforcement, enhanced requirements of employers, and expanded guestworker visa programs.

1986
Simpson-Mazzoli Act signed into law by Ronald Reagan (Amnesty)
1990
Breakup of Yugoslavia

Yugoslavia breaks into multiple countries through a series of violent conflicts. During this time, the Diocesan Refugee Services Committee becomes Interfaith Refugee Ministry (IRM) and resettles Bosnian, Croatian, Serbian, and other former Yugoslavian families who arrive in Connecticut.

1990
Immigration Reform Act of 1990
Birth of H1-B program
1994
The Iraqi Kurdish Civil War begins

The war begins in May of 1994, and continues until November of 1997. Over these three years, the war displaces many Kurdish civilians.

1994
1994 passage of section 245(i) Amnesty
Birth of H1-B program
1995
IRM resettles Cuban rafters who arrive in Connecticut
1996
IRM resettles Kurdish families who arrive in Connecticut

During this time, congress revises the Immigration Act of 1965 by implementing the H-1B visa program for skilled temporary workers, with some provisions for conversion to permanent status, and the diversity visa lottery for populations unable to enter through the preference system.

1996
Illegal Immigration Act of 1996
Birth of e-verify
1997
Renewal of Section 245 (i)
1997
Nicaraguan Adjustment and Central American Relief Act

The United States implements the Nicaraguan Adjustment and Central American Relief Act (NACARA), which allowed certain Salvadorans, Guatemalans, and Nicaraguans who had fled violence and poverty in their homelands in the 1980s to file for asylum and remain in the United States.

1998
Kosovar Albanians flee from the conflict in Kosovo

Following this, IRM works to resettle Kosovar families who arrive in Connecticut.

2000
Renewal of Section 245 (i) Dream Act of 2000
2000
The United Nations General Assembly launches World Refugee Day

In 2000, June 20th becomes World Refugee Day. Each year, the worldwide community spends the day focused on ways to improve the lives of refugees.

2001
IRM resettles Lost Boys of Sudan who arrive in Connecticut

In the following years, the United States invades Afghanistan and battles the Afghanistan government and the Taliban, displacing many civilians.

2001
9/11 and the reshaping of the US national security bureaucracy (Homeland Security Act)
2002
Enhanced Border Security and Visa Entry Reform Act

After the attacks of September 11th, the U.S. government acted to expand the budget, staffing, and powers of the immigration enforcement bureaucracy.

2003
The Liberian capital of Monrovia is sieged during war, displacing thousands of civilians
2007
2007 Immigration Reform Bill fails in Congress (Guest Worker Program)
2004
IRM resettles Liberian families who arrive in Connecticut

In the following years, insurgency and civil conflicts caused by the United States’ invasion of Iraq displaces many civilians.

2007
IRM begins resettling the Afghan and Iraqi families who arrive in Connecticut

During this time, IRM officially changes its name to IRIS- Integrated Refugee & Immigrant Services.

2011
The Syrian Civil war begins to displace many civilians
2012
2012 DACA executive order (E.O.) is signed into law as a temporary solution
2012
Deferred Action for Childhood Arrivals (DACA)

Trying to cope with the long-term residence of millions of unauthorized immigrants, this executive order provided protection from deportation and work authorization to persons who arrived as minor children and had lived in the United States since June 15, 2007.

2014
DAPA E.O. challenged in court
2013
Connecticut becomes a sanctuary state

The Connecticut state legislature passed the Trust Act, and it was signed by Governor Dannel Malloy. 

2014
The Islamic State of Iraq and Syria (ISIS) rises to power and displaces many Iraqi and Syrian civilians

During this time, after over 30 years as a program of the Episcopal Church in Connecticut, IRIS takes steps to become an independent organization, with their continued support of our mission.

2015
IRIS begins resettling Syrian families who arrive in Connecticut
2016
IRIS expands its community co-sponsorship program

In response to the Syrian refugee crisis, and with tremendous community support, IRIS welcomes 530 refugees—more than double any previous year.  One-third of these families are resettled by community groups in towns and cities across the state, through IRIS’s expanded community co-sponsorship program.

2017
The US reduces the amount of refugees admitted

US admissions historically have been around 70 – 85,000 and higher. Beginning with the end of the wet feet, dry feet policy in January of 2017, the US reduced the amount of refugees who could be admitted into the country to a maximum of 30,000, and instituted a travel ban from several predominantly Muslim countries. This ban also suspended the resettlement of all Syrian refugees.

During this time, IRIS resettled 343 refugees, and the CT community continued to support refugees arriving in CT.

2020
The COVID-19 pandemic leads to nationwide lockdowns

During this time, IRIS transitioned to operating remotely.

2021
IRIS opens the Hartford office
2017
2017 executive orders aimed at curbing migration (Muslim ban)
2018
2018 Supreme Court ruling expanding definition of public charge
2024
2024 Bipartisan immigration bills fails in Congress

The Economic Impact of Migration on Connecticut

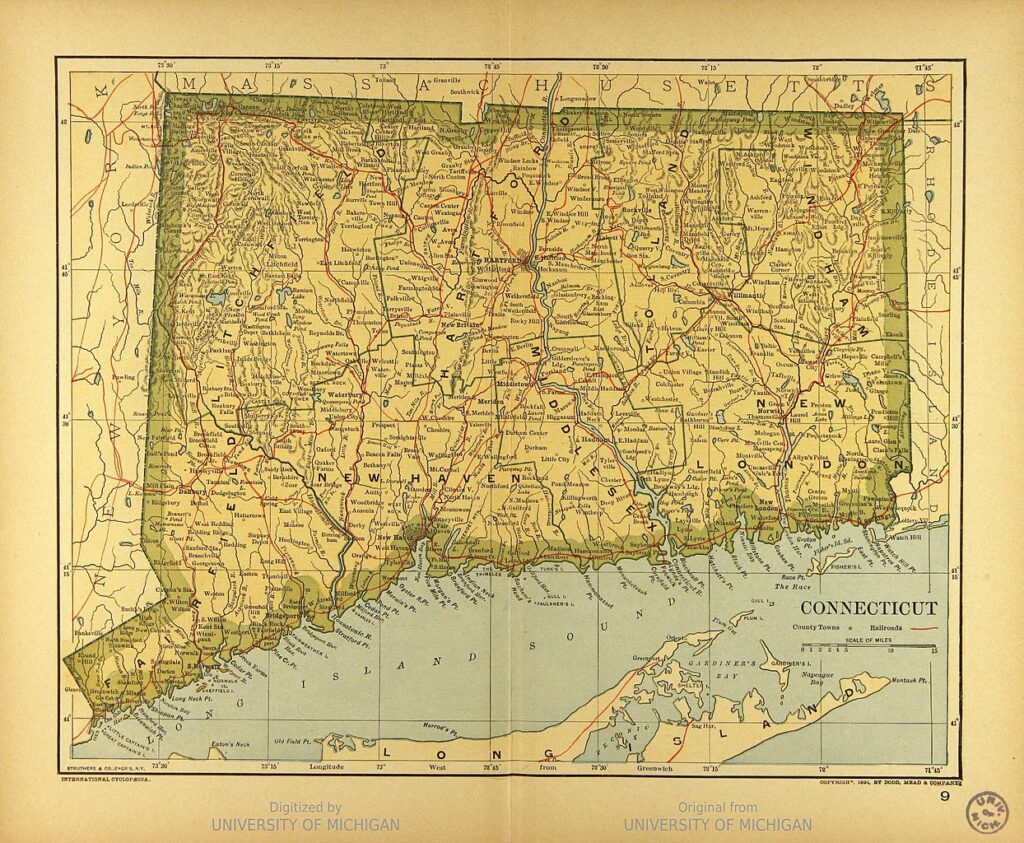
Map_of_Connecticut

Immigration plays a vital role in Connecticut’s economy and society, driving growth, innovation, and cultural enrichment. With roughly 15% of the state’s population born outside the United States and an additional 16% with at least one immigrant parent, immigrants are integral to Connecticut’s identity.

They are not only part of the community but also key contributors to the state’s economy—one in six workers in Connecticut is an immigrant, filling critical roles in industries like construction, healthcare, and technology. Immigrant-led households paid a remarkable $7.4 billion in federal, state, and local taxes in 2018, and undocumented immigrants contributed over $500 million in taxes, showcasing their commitment to the state’s fiscal health. Immigrants are also entrepreneurial, with nearly50,000 immigrant business owners generating $1.2 billion in business income>, accounting for 24% of all self-employed residents.

Furthermore, over50% of Connecticut’s foreign-born residents are naturalized U.S. citizens, strengthening civic participation and enriching the social fabric. By creating jobs, bolstering tax revenues, and enhancing cultural diversity, immigrants are not just residents of Connecticut—they are drivers of its prosperity and progress.

Economic Contributions of immigrants

Immigrants' Economic Contributions

Foreign Born v. US Born

Demographic Comparisons

Immigrant Tax Contributions in Connecticut

Immigrant Tax Contributions

Immigrant Spending Power Impact

Immigrant Spending Power Impact

Top Industries with the Highest Share of Immigrant Workers

Top Industries for Immigrant Workers

Education levels: foreign born v US born

Education Levels: Foreign-Born vs U.S.-Born

Foreign-Born Population by County

Foreign-Born Population by County

Naturalized Citizenship Rates

Naturalized Citizenship Rates by County

Immigrant Population Percentage by County

Immigrant Population Percentage by County

Did you know?

  • Roughly 15% of Connecticut’s population is comprised of people born outside the United States. That’s about one in seven people!
  • An additional 16% of Connecticut residents are native-born citizens with at least one immigrant parent!
  • Since 1990, the foreign-born population in Connecticut has nearly doubled!
  • More than half of all immigrants in Connecticut are naturalized citizens of the United States!
  • Over 3,500 active DACA recipients live in Connecticut, and even more residents are eligible. Only about one third of DACA-eligible immigrants in Connecticut had applied for DACA as of 2019.
  • One in six workers in Connecticut is an immigrant, and immigrant workers make up large shares of all workers in several industries and occupations, including construction, healthcare support, and computer and mathematical fields.
  • Immigrants in Connecticut contribute greatly to the economy. In 2018, immigrant-led households in Connecticut paid $4.8 billion in federal taxes and an additional $2.6 billion in state and local taxes. Undocumented immigrants in Connecticut are estimated to have paid over $335 million in federal taxes and nearly $200 million in state and local taxes, while DACA recipients and DACA-eligible individuals are estimated to have paid nearly $14 million in state and local taxes.
  • Nearly 50,000 immigrant business owners live in Connecticut. They accounted for 24% of all self-employed residents of Connecticut in 2018 and generated $1.2 billion in business income that year.
  • Connecticut is one of eleven sanctuary states!

CONNECTICUT COUNTIES IMMIGRATION FACTS

Hover over the markers to discover immigration facts for each county.

map-of-ct
FAIRFIELD
  • Fairfield is home to an estimated 217,000 foreign born people
  • Over half of the foreign born people in Fairfield are naturalized US citizens
  • 71% of foreign born people in Fairfield are in the labor force. This is higher than both the rates for the total population (67%) and for the native born population (66%), with foreign born people who are not citizens having the highest rate of all (74%)
  • 22% of the population of Fairfield County are immigrants. That's the highest percentage in the state!
HARTFORD
  • Hartford is home to an estimated 134,000 foreign born people
  • Nearly 60% of the foreign born people in Hartford are naturalized US citizens
  • Roughly 22% of the population of the city of Hartford are immigrants!
  • At 15%, Hartford County has the second highest percentage of foreign-born in Connecticut!
  • 1 in 4 foreign-born people in Hartford arrived after 2010
NEW HAVEN
  • New Haven is home to an estimated 127,000 foreign born people
  • 53% of the foreign born people in New Haven are naturalized US citizens
  •  38% of the foreign born population in New Haven have a bachelor's degree or have completed a graduate or professional degree
  • 12% of the population of New Haven County are immigrants
  • 17% of the population of the city of New Haven are immigrants
  • With 75% earning less than $75,000 per year, and 50% earning less than $40,000 per year, the median household income for an immigrant-headed household in New Haven (about $40,000 per year) is significantly lower than the median income of immigrant-headed households in the rest of the state (about $64,000 per year).
LITCHFIELD
  • Litchfield is home to an estimated 14,000 foreign born people
  • 58% of the foreign born people in Litchfield are naturalized US citizens
TOLLAND
  • Tolland is home to an estimated 10,000 foreign born people. That's almost 7% of the population!
  • 53% of the foreign born people in Tolland are naturalized US citizens
  • 7% of the population of Tolland are immigrants
WINDHAM
  • An estimated 4.6% of the population of Windham are foreign born persons
  • 5% of the population of Windham are immigrants, the lowest percentage in the state.
MIDDLESEX
  • Middlesex is home to an estimated 13,000 foreign born people
  • 64% of the foreign born people in Middlesex are naturalized US citizens
  • 8% of the population of Middlesex are immigrants
NEW LONDON
  • New London is home to an estimated 23,000 foreign born people
  • 60% of the foreign born people in New London are naturalized US citizens
  • About 10% of the population of New London are immigrants

Citations

https://www.americanimmigrationcouncil.org/research/immigrants-connecticut https://d101vc9winf8ln.cloudfront.net/documents/37493/original/CT_Hartford_iDod_Fact_Sheet.pdf?160433651 https://d101vc9winf8ln.cloudfront.net/documents/41455/original/New_Haven_Connecticut_iDodfactsheet.pdf?1635351467 https://data.census.gov/table?g=0400000US09$0500000&tid=ACSST1Y2021.S0501 https://data.census.gov/table?g=0400000US09$0500000&tid=ACSST5Y2021.S0501 https://data.census.gov/table?g=0400000US09$0500000&tid=ACSST1Y2021.S0502 https://data.census.gov/table?g=0400000US09$0500000&tid=ACSST5Y2021.S0502 https://www.census.gov/quickfacts/windhamcountyconnecticut https://www.fairus.org/issue/sanctuary-policies/do-you-live-1-11-sanctuary-states https://www.migrationpolicy.org/data/state-profiles/state/demographics/CT https://portal.ct.gov/-/media/POST/GENERAL_NOTICES/2019/19-05-Act-Concerning-the-Trust-Act.pdf